Your daily frequent11y newsletter, brought to you by @ChrisBAshton:
Tech volunteers develop new online tool to help visually impaired access COVID-19 data
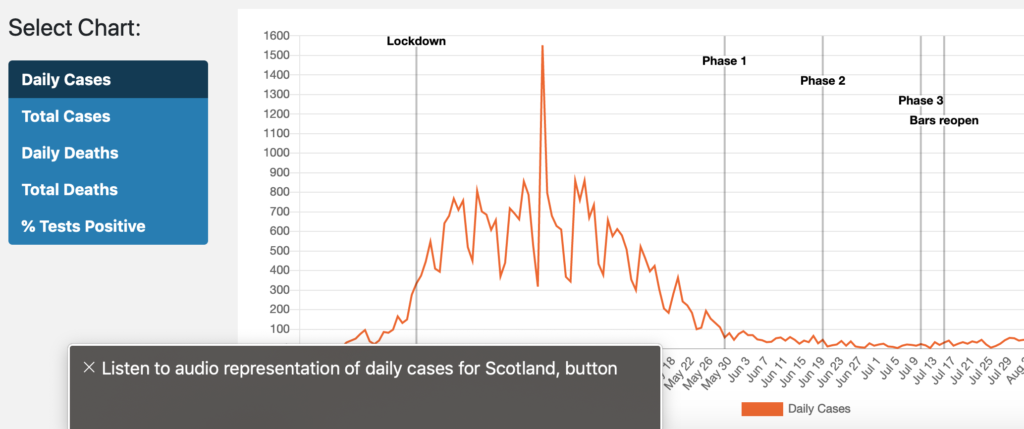
- The ‘Scottish Tech Army’ have created a dashboard of COVID-19 statistics in Scotland, which, in a ‘world first’ uses ‘sonification’ to interpret visual data as sound. This enables screen reader users to get an idea of the general trend of a chart, without having to keep track of every data point like they would in a table. I’m not a screen reader user myself, so don’t know how useful this is, but it is certainly an interesting experiment. To try, turn on your screen reader and navigate to the visually hidden “Listen to audio representation of daily cases for Scotland” button.
Prefer longer newsletters? You can subscribe to week11y, fortnight11y or even month11y updates! Every newsletter gets the same content; it is your choice to have short, regular emails or longer, less frequent ones. Curated with ♥ by developer @ChrisBAshton.